Astronaut Time in Space
library("tidyverse")
library("patchwork")
theme_set(theme_minimal())
tt_gh <- tidytuesdayR::tt_load_gh("2020-07-14")
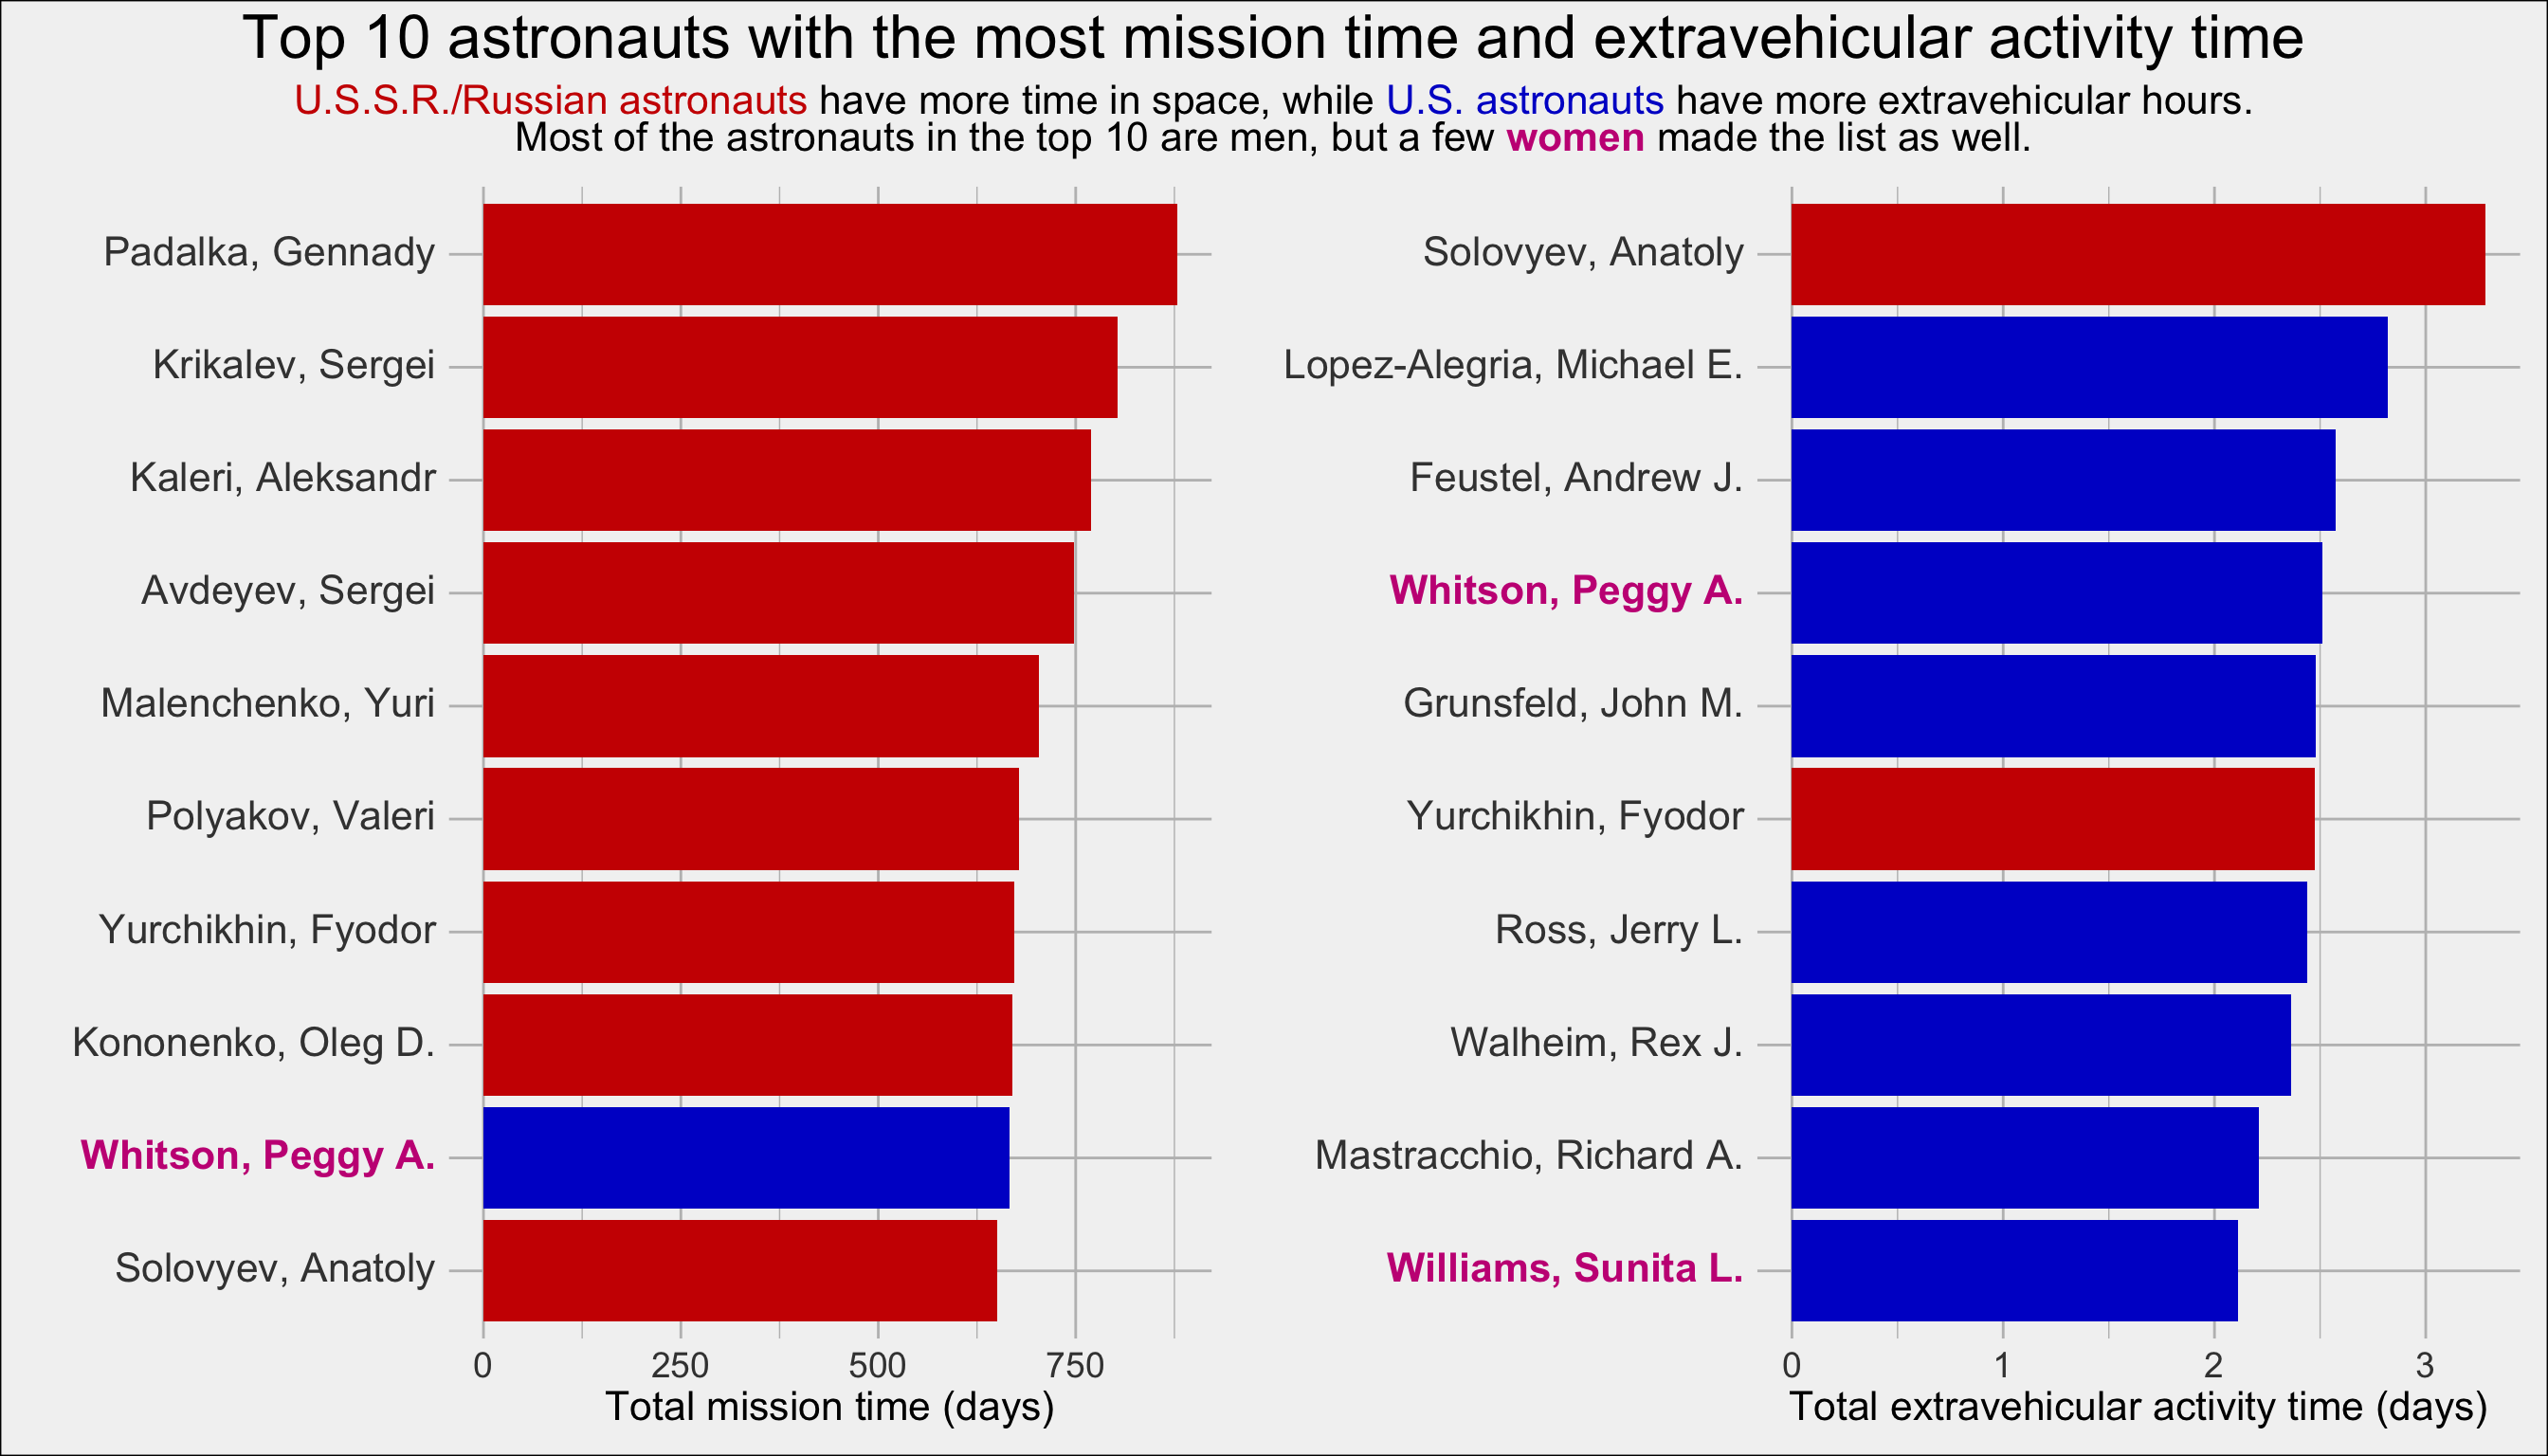
astronauts <- tidytuesdayR::tt_download_file(tt_gh, 1)This week’s Tidy Tuesday data set includes astronauts and their space voyages. Two of the variables included in the data are total_hrs_sum (total duration of all missions in hours) and total_eva_hrs (total duration of all extravehicular activities in hours). I decided to use use these variables to see which astronauts had spent the most time in space, as well as the most time on spacewalks and other activities outside their spacecraft. While there are far more male astronauts in the data set, I was interested to see if any women made it on to the list of astronauts who have spent the most time in space. I also broke it down by astronaut nationality.
# Creating a data set with each astronaut's total time in space, sex, and nationality
# Using slice to select only the top 10 astronauts
# Converting hours in space to days in space
# Adding html formatting to female astronauts' names so I can use the ggtext package to make their axis labels a different color

space_hours <- group_by(astronauts, name) %>%
  summarize(sex = first(sex),
            nationality = first(nationality),
            total_hrs_sum = first(total_hrs_sum)) %>%
  arrange(-total_hrs_sum) %>%
  slice(1:10) %>%
  mutate(total_days_sum = total_hrs_sum/24,
         name = ifelse(sex == "female",
                               glue::glue("<strong><span style='color:mediumvioletred'>{name}</span></strong>"),
                               as.character(name)),
         name = fct_reorder(name, total_hrs_sum))

# Using the same process to create a data set with each astronaut's total eva time
eva_hours <- group_by(astronauts, name) %>%
  summarize(sex = first(sex),
            nationality = first(nationality),
            total_eva_hrs = first(total_eva_hrs)) %>%
  arrange(-total_eva_hrs) %>%
  slice(1:10) %>%
  mutate(eva_days_sum = total_eva_hrs/24,
         name = ifelse(sex == "female",
                               glue::glue("<strong><span style='color:mediumvioletred'>{name}</span></strong>"),
                               as.character(name)),
         name = fct_reorder(name, total_eva_hrs))
# Creating a plot of the top 10 astronauts' total time in space
# ggtext::element_markdown renders the html that I added to the female astronauts' names, making the text a different color
(p1 <- space_hours %>%
ggplot(aes(x = total_days_sum, y = name, fill = nationality)) +
geom_col() +
labs(x = "Total mission time (days)",
y = "",
fill = "") +
scale_fill_manual(values = c("blue3", "red3")) +
theme(plot.title.position = "plot",
axis.title = element_text(size = 16),
axis.text = element_text(size = 14, color = "gray25"),
axis.text.y = ggtext::element_markdown(size = 16),
panel.grid = element_line(color = "grey")))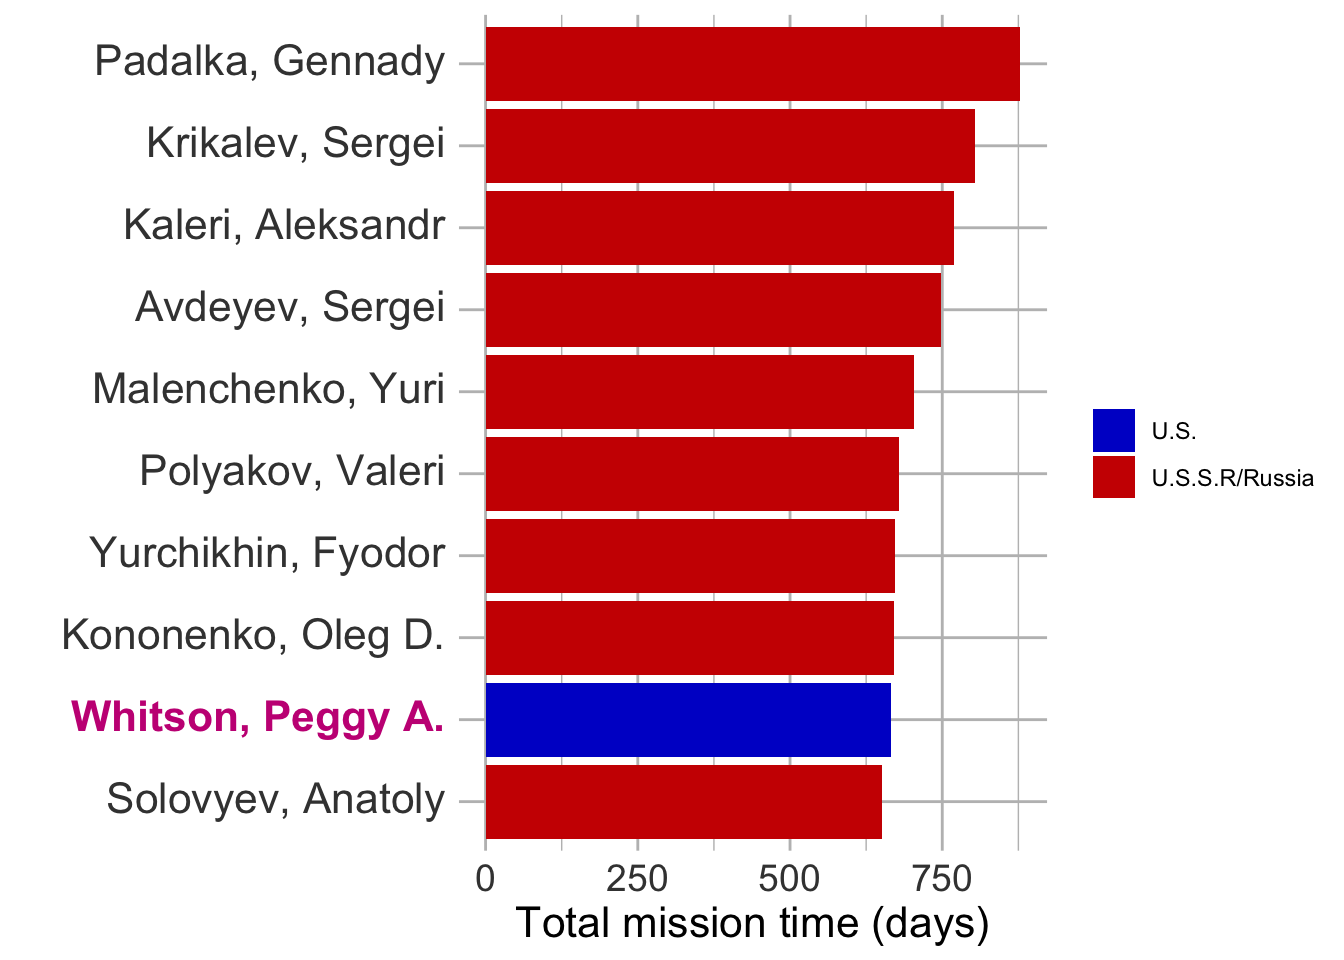
# Creating a plot of the top 10 astronauts' total eva time
# ggtext::element_markdown renders the html that I added to the female astronauts' names, making the text a different color
(p2 <- eva_hours %>%
  ggplot(aes(x = eva_days_sum, y = name, fill = nationality)) +
  geom_col() +
  labs(x = "Total extravehicular activity time (days)",
       y = "",
       fill = "") +
  scale_fill_manual(values = c("blue3", "red3")) +
  theme(plot.title.position = "plot",
        axis.title = element_text(size = 16),
        axis.text = element_text(size = 14, color = "gray25"),
        axis.text.y = ggtext::element_markdown(size = 16),
        panel.grid = element_line(color = "grey")))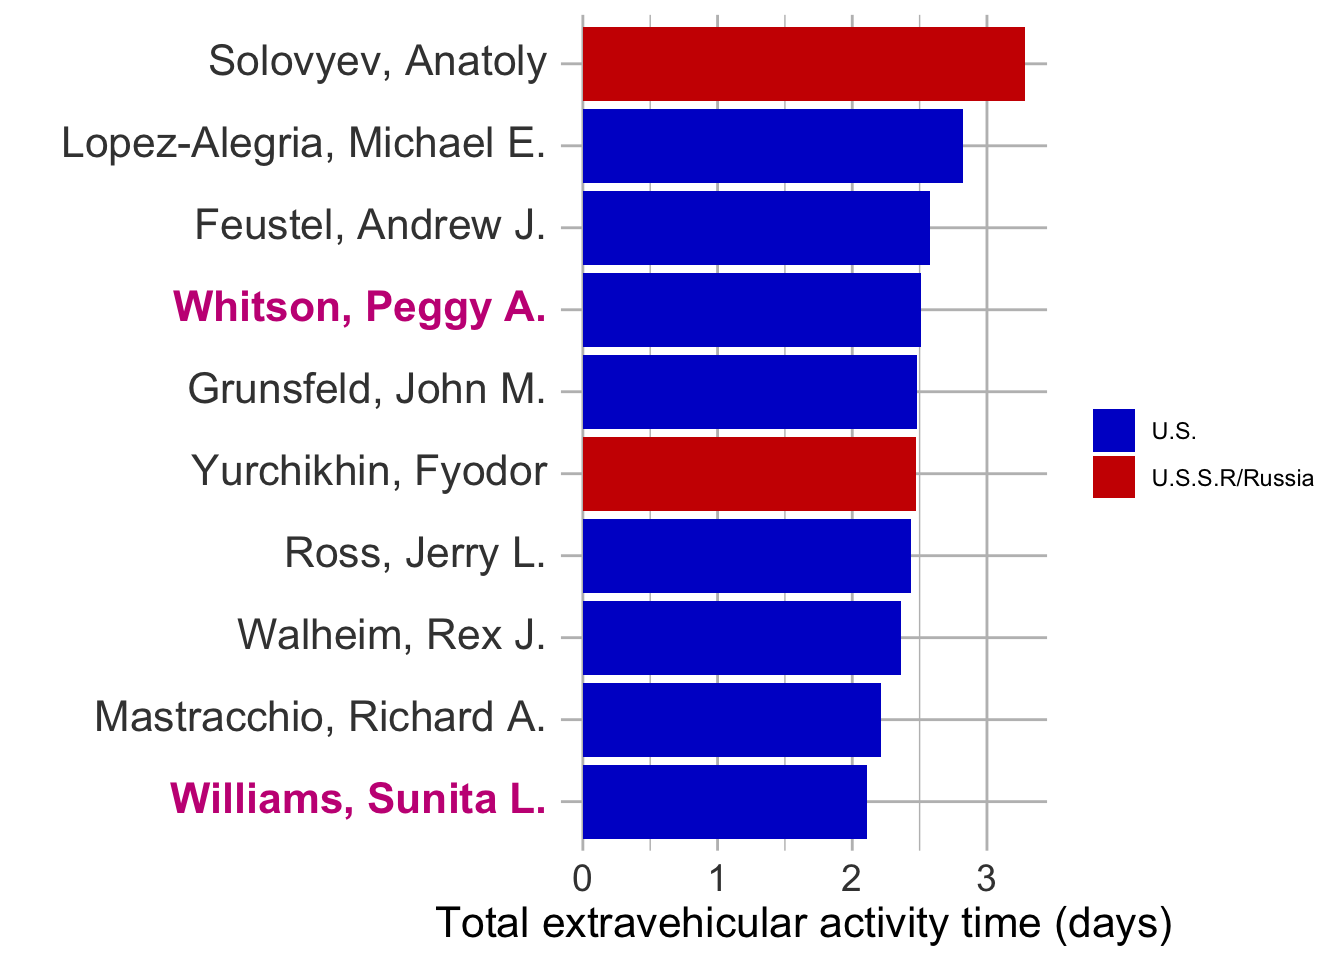
After making individual graphs of total time in space and eva time, I wanted to be able to compare them side by side, so I used the patchwork package to combine the plots into one.
# Using html formatting and ggtext::element_markdown to make the font in the subtitle match the nationality colors in the plots
# This makes it so I don't need to use a legend for just two categories

p1 + p2 +
  plot_layout(guides="collect") +
  plot_annotation(title = "Top 10 astronauts with the most mission time and extravehicular activity time",
                  subtitle = "<span style='color:red3';>U.S.S.R./Russian astronauts</span> have more time in space, while <span style='color:blue3';>U.S. astronauts</span> have more extravehicular hours.<br>
                  Most of the astronauts in the top 10 are men, but a few <strong><span style='color:mediumvioletred'>women</span></strong> made the list as well.",
                  theme = theme(plot.title = element_text(size = 24, hjust = .5),
                                plot.subtitle = ggtext::element_markdown(size = 16, hjust = .5),
                                plot.background = element_rect(fill = "gray95"),
                                legend.position = "none"))